Of all the components of atmospheric deposition, acid rain is probably the most commonly known in New England. In this section most of the discussion will focus on acid rain, or acidic precipitation, which includes acid rain and snow, acidic fog and ice. In addition to the discussion on acid rain, in the future, there will be brief reports on dry deposition in New England and deposition of toxic trace elements and toxic compound deposition (in particular mercury).
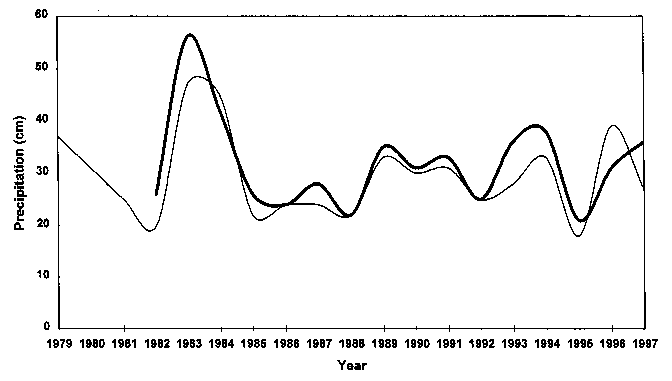
The New England map, presented in Figure 1, depicts the approximate location of the 10 NADP/NTN sites in the region. The sites are equipped with al Belford 5-780 Universal Rain Gage, and an Aerochem Metrics Wet/Dry Precipitation Collector. Most sites are located well inland, with the exception of the Waltham/Boston, the Cape Cod National Seashore, and the Acadia National Park monitoring sites, which are located near the coast. Seasonal and annual differences in weather patterns influence precipitation and chemical deposition patterns at the inland and coastal sites. Differences in the annual and seasonal amount of precipitation measured at the seven New England sites, over the past nineteen years (1979-1997), are presented in Figures 2a and 2b.
 *National Atmospheric Deposition Program/National Trends Network
The data presented in Figures 2a and 2b indicate that the amount of precipitation and seasonal pattern of precipitation changes over time and by site. These patterns influence the concentration and deposition of pollutants in precipitation. Inland sites generally record the most precipitation during the summer (and fall), and the least precipitation during the winter. Coastal sites (Cape Cod National Seashore, Acadia National Park, and Waltham/Boston), on the other hand, generally record more precipitation during the spring. The is clearly evident during the late 1980's and early 1990's.


Over the past 19 years, the precipitation data collected at the New England NADP sites suggest to multi-year intervals with enhanced precipitation. Two-year (paired) averaged data are presented in Figure 3. These data show enhanced precipitation in New England during the early 1980's and again during the early 1990's. Less precipitation fell during the period 1985-1988.

Precipitation has complex chemistry. Both beneficial and harmful pollutants are present. Acid precipitation illustrates this. In general, the dilute chemical constituents of acid precipitation are composed of beneficial plant and soil nutrients (calcium, magnesium, potassium, nitrogen) and harmful acids, principally sulfuric and nitric acids. Nitrates play several roles; they contribute to the acidity of the precipitation and to freshwater acidification, and they can be a plant nutrient. As a plant nutrient they are important to New England forests, but enhance the eutrophication of some New England coastal marine environments, including Long Island Sound and Casco Bay (These are New England ecosystems where scientific research is focusing on the potential environmental effects for nitrogen and enhanced eutrophication).
The following anions and cations are measured from precipitation samples set to the NADP/NTN central analytical laboratory:
| anions | cations |
|---|---|
| Sulfate (SO4 | Hydrogen (H) |
| Nitrate (NO3 | Calcium (Ca) |
| Orthophosphate (PO4 | Magnesium (Mg) |
| Chloride (Cl) | Potassium (K) |
| Sodium (Na) | |
| Ammonium (NH4 |
In addition to these anions and cations, the conductance of each sample (a secondary measure of ionic strength) is also measured. Precipitation samples from all of the NADP/NTN collectors are shipped every Tuesday to the Central Analytical Laboratory (CAL) at the Illinois State Water Survey for analysis.
Figure 4 presents the average composite yearly deposition of sulfates, nitrates, and chlorides for the ten NADP/NTN sites in New England. Nitrate deposition, in New England, shows no significant long-term increase or decrease in deposition over the period of record. The decrease in 1987-1988 may be attributed to lower precipitation. Sulfate deposition, on the other hand, significantly drops during the early 1980's and again during the 1990's. The decreased deposition during the 1987-1988 period is attributed to reduced precipitation. However, the long-term trend, and the most recent declines in sulfate deposition can only partially be attributed to changes annual precipitation.

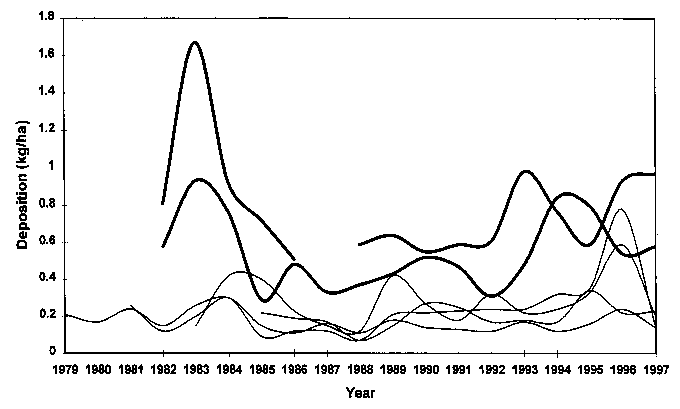
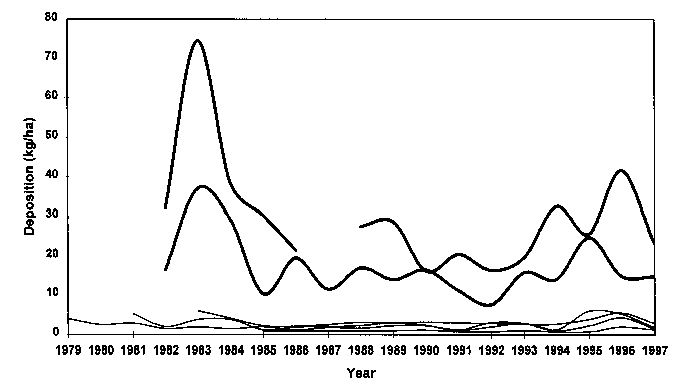
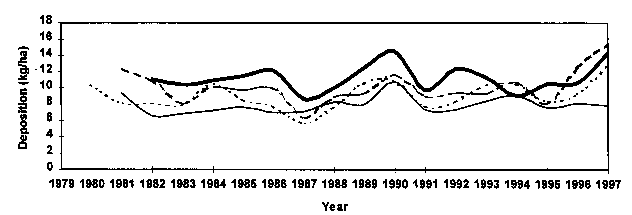
The final series of figures provide sub-regional views of changes in precipitation chemistry over the past 19 years. Coastal and inland sites show different patterns of deposition, over the years. Chloride and potassium enrichment is evident at the coastal sites, indicative of precipitation that has been influenced by sea spray. This enrichment is especially evident during 1983 and 1984 (Figure 5a and 5b). Inland sites, on the other hand, do not show similar patterns of chloride or potassium enrichment. Sulfate, which is also a major constituent of seawater, is also enriched at coastal sites, as noted at the Acadia NP site in Maine and the Cape Cod National Seashore site (Figure 6a). The Acadia site also records generally higher deposition of nitrates than the other Maine sites (Figure 7a). This is unexpected, since this site is located far from major point and mobile emission sources of nitrogen oxides in New England, and ocean spray does not contain significant concentrations of nitrate.


The final set of figures indicate a south to north and west to east gradient of sulfate and nitrate deposition (except in those instances where a sea spray enhances sulfate deposition). As expected, the highest deposition of sulfate generally occurs west of Maine (Figures 6a-6c). The highest nitrate deposition occurs at the New Hampshire, Vermont and Quabbin Reservoir-Massachusetts monitoring sites (Figures 7b and 7c).


The most recent data for 1993 through 1997 show no marked systematic trend of pollutants in precipitation for the New England sites. Sulfate deposition in 1995 showed a marked decline at every monitoring site except Acadia NP in Maine. The average 1995 sulfate deposition in New England was the lowest ever recorded during the 17 years of sulfate deposition monitoring. The 1996 data indicate that sulfate deposition increased in eight of the ten sites. Nonetheless, sulfate levels in 1996 were ~16% below historical averages (1979-1995). Similar increases occur for nitrate at most sites, and appear to be enhanced in 1997. Nitrate deposition during 1996 and 1997 were virtually the same (~5+%) as the historical average (1979-1995). This trend for nitrate and to some extent sulfate continued in 1997, suggesting the possibility that the deposition pattern for New England 1995 data may be more related to year-to-year changes in atmospheric chemistry and weather conditions than other deposition modifiers, such as emission reductions.
The year-to-year variation that is recorded at the NADP sites can be attributed to differences in precipitation and prevailing wind patterns, as well as emission sources. This is characteristic of precipitation data and should be viewed as normal. Trends in pollutant deposition within New England, whether due to long-term changes in pollutants emitted to the atmosphere or trends in climate, will be evident only after many years (10-20+ years).